Dashboard Portfolio
How I think about dashboards that help people decide
Each dashboard starts with a practical question: what does someone need to see quickly to make a better decision? I organize sources and business rules, define the metrics, and create direct navigation — connecting operations, data, and interpretation in analyses for any segment or area of your business.

Google Analytics Dashboard
The default Google Analytics interface doesn't let you cross traffic, engagement, and conversion the way I needed to track day to day, so I pulled the data into Power BI. The result is a single dashboard to see where traffic comes from and what it actually generates.

Personal Finance
Tracking expenses in a spreadsheet scattered information across separate tabs and made it hard to see the full monthly picture. This dashboard brings spending, bills, and categories into one place, making spending patterns and cuts easier to spot.
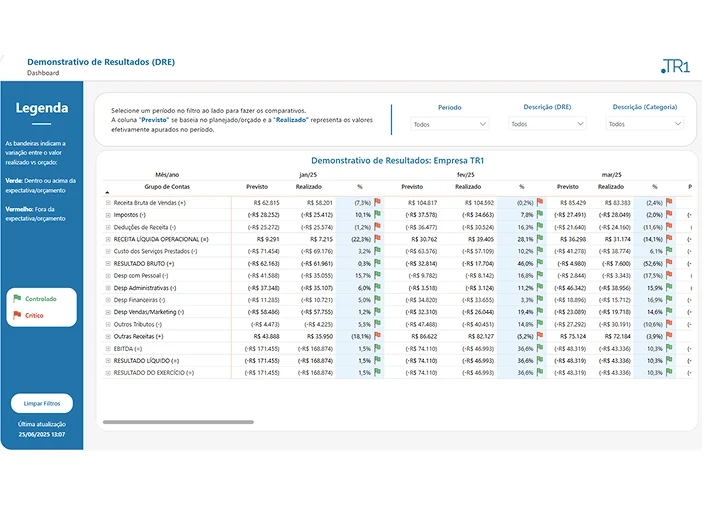
Income Statement
A static income statement in a spreadsheet tends to hide what actually matters: where the margin is being lost. I built an interactive Power BI version to visualize revenue, costs, and results clearly, without relying on hidden formulas.
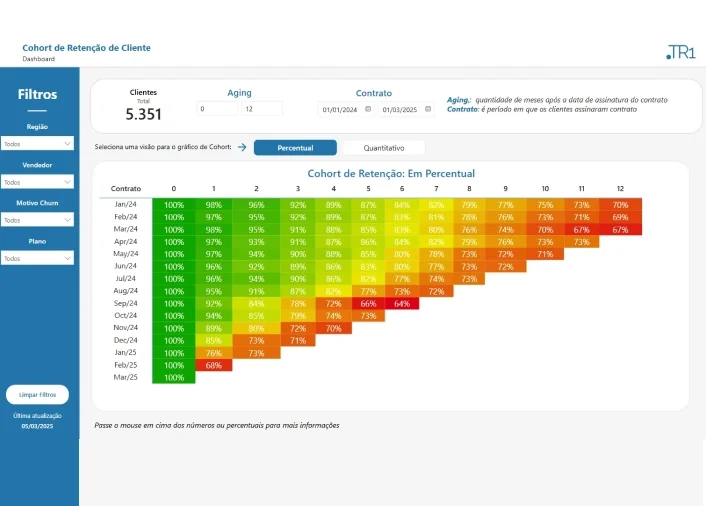
SaaS Cohort
Retention metrics scattered across a monthly report don't show the real churn trend. I modeled a cohort analysis in Power BI to track SaaS customer retention and churn over time — an essential signal for any subscription business.
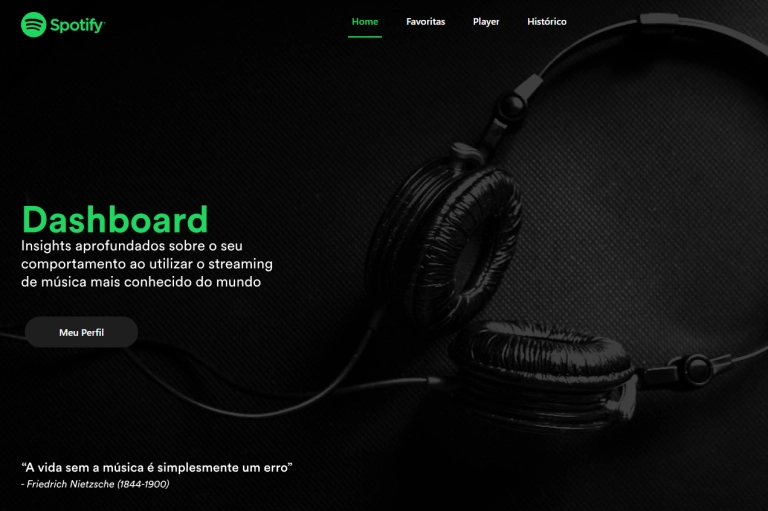
Spotify Insights
A personal side project born from curiosity about my own listening habits: I connected the Spotify API to a Power BI dashboard to track artists, genres, and listening times over time.
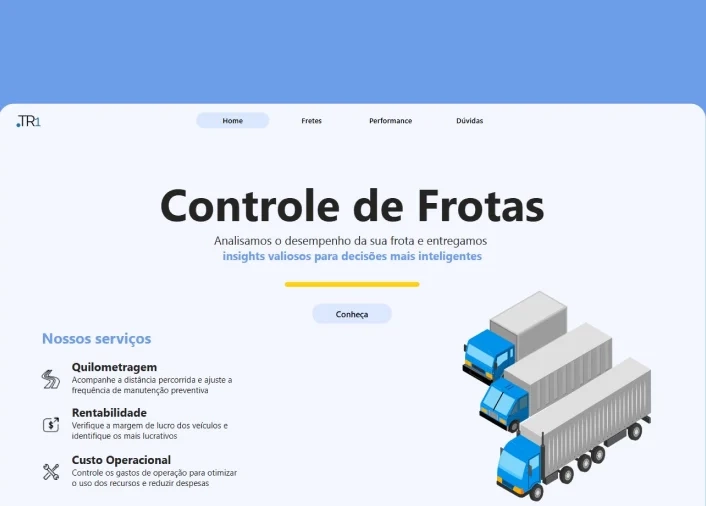
Fleet Management
Fleet costs used to live scattered across spreadsheets, with no clear view of which vehicles were actually profitable. This Power BI dashboard consolidates mileage, maintenance, and profitability per vehicle.
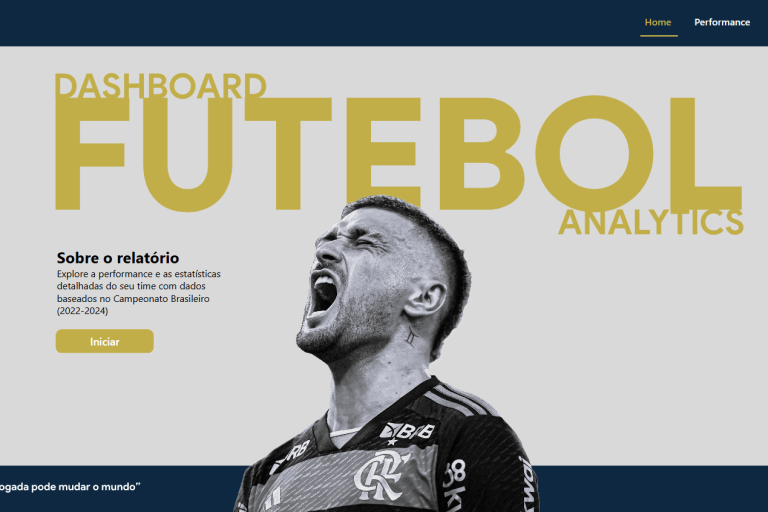
Football Analytics
I modeled Brazil Serie A match data in SQL Server and built a Power BI layer on top of it, turning passing, finishing, and heatmap stats into something a coach or fan can read in seconds.
Next step
Need a dashboard to support decisions?
I can structure metrics, modeling, and visuals so your data becomes a clear view for better decisions.